
Table Shape
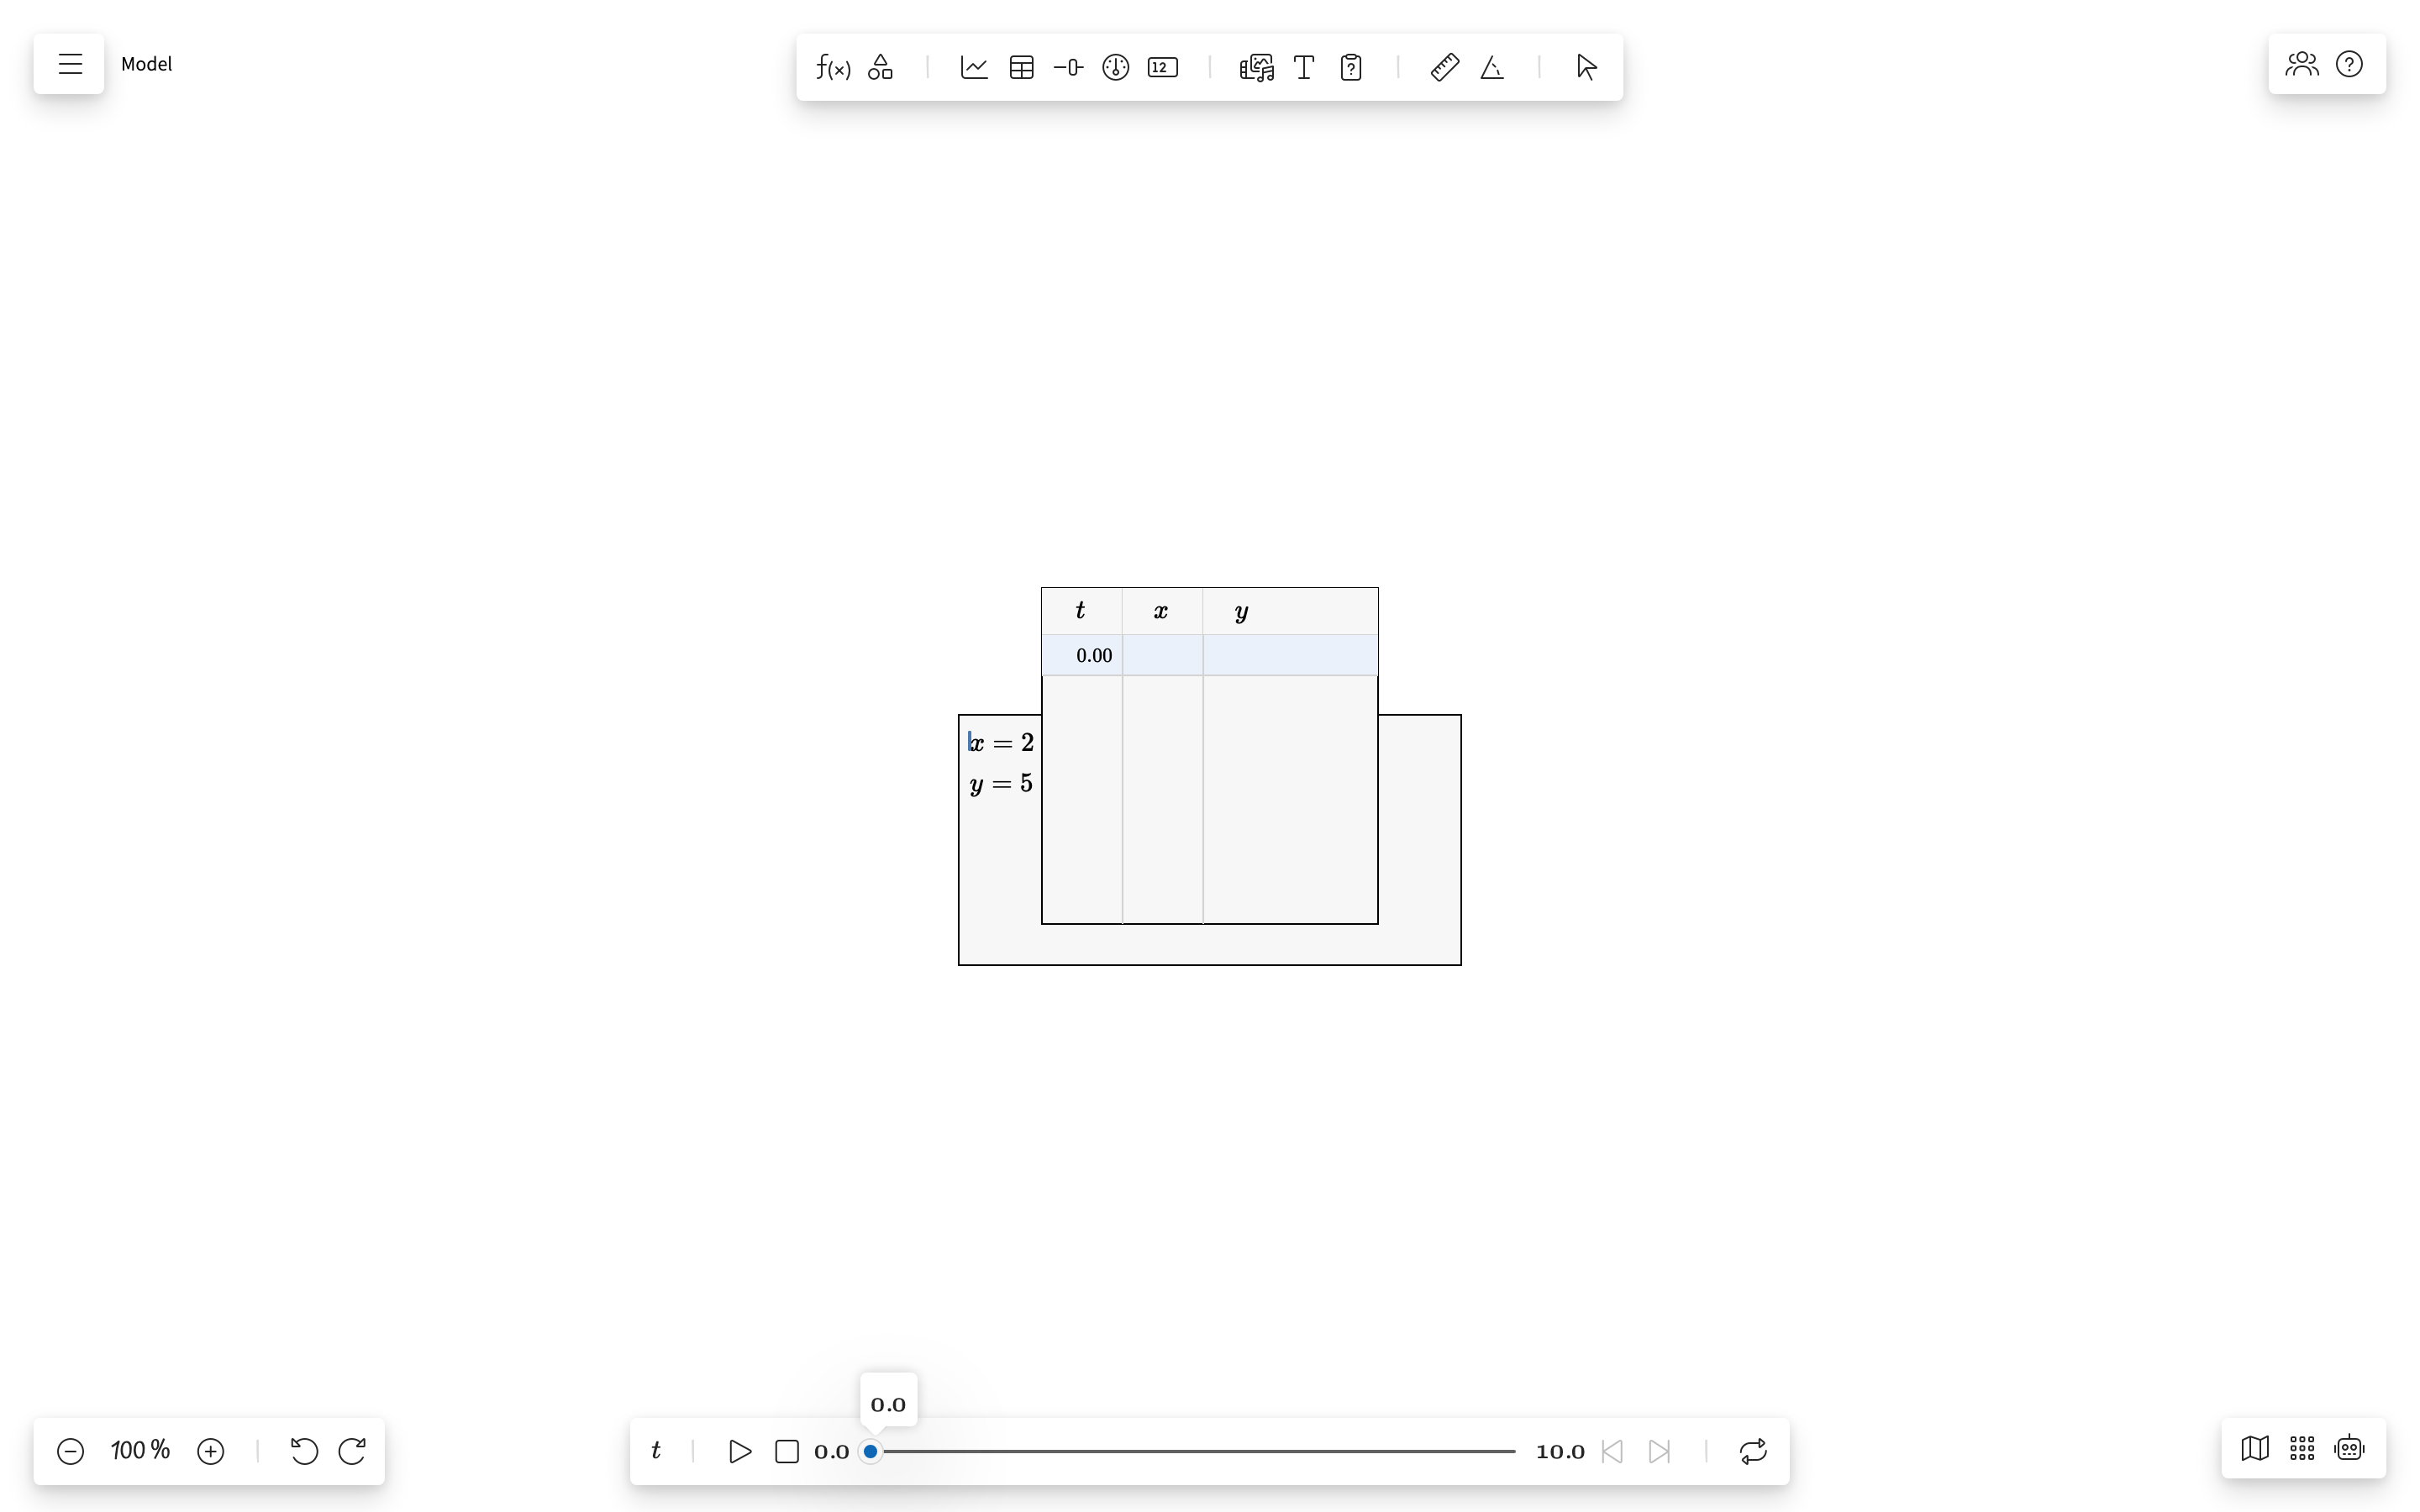
The Table shape displays computed values from your model, allows manual data entry, and provides cell selection for performing regression analysis.
Overview
A Table shape shows the value of selected terms at each iteration step. It can display both computed columns (from expressions) and user-entered data columns. Tables are essential for data analysis workflows — you select cells, apply regression, and see results in linked charts.
Adding the Shape
Open the table button in the top toolbar and choose Table, then click and drag on the board to draw it. The same dropdown also offers the Initial Values table for editing the starting values of input terms.
Toolbar
Screenshot: Table toolbar with column picker, regression method, and options
The Table toolbar provides:
- Column picker — Choose which terms to display as columns
- Add data column — Add a manually-editable column
- Regression method — Apply regression to selected data
- Color picker — Change shape accent color
- Delete — Remove the table from the board
Column Types
| Type | Description | Editable |
|---|---|---|
| Computed | Values calculated from model expressions at each iteration | No |
| Data | User-entered values for experimental or reference data | Yes |
| Regression | Column generated by a regression fit | No |
Cell Selection
Screenshot: Table with cells selected (highlighted) for regression
To perform regression analysis:
- Click and drag to select a range of cells in a data column
- The selected range is highlighted
- Choose a regression method from the toolbar dropdown
- The regression result is created as a new term in the model
Select cells from two columns (X and Y) to define which data pair to use for the regression fit.
Regression Methods
| Method | Fit Function | Output |
|---|---|---|
| No Regression | — | Clears any existing regression on the selection |
| Linear | y = ax + b | Creates a regression term with slope and intercept |
| Quadratic | y = ax² + bx + c | Creates a regression term with quadratic coefficients |
Working with Regression Results
When you apply a regression:
- A new term is created in the calculator (type: REGRESSION)
- The regression curve can be displayed in a Chart shape
- Outlier data points are automatically detected
- The regression parameters (slope, intercept, etc.) are available as term properties
See Regression for a full workflow guide, and Outliers for how outlier detection works.
Properties Panel
Screenshot: Table properties panel
| Property | Description |
|---|---|
| Columns | List of terms displayed in the table |
| Show iteration | Whether to show the iteration/step column |
| Decimal places | Number of decimal digits to display |